Creative reporting tool junior marketers can easily use: Motion
Motion is a creative reporting tool accessible for marketers at any level, from junior ICs to CMOs. It pulls ad data from Meta, TikTok, Youtube, and LinkedIn into customizable visual reports. Motion reports are simple to build and make ad data easy to understand.
If you've ever spent Friday afternoon frantically copying data into a deck for your Monday meeting, you already know the problem Motion solves.
Why junior marketers struggle with creative reporting
Most creative reporting tools weren't built with you in mind. They were designed for data analysts at enterprise companies who have time for training sessions and technical documentation.
Meanwhile, you're expected to:
Pull performance data from multiple ad platforms
Explain which creative variations are working and why
Create visually compelling reports that executives actually want to read
Do all of this while managing campaigns, responding to Slack messages, and attending meetings
The typical solution? Hours in Google Sheets, manually exporting CSVs, copying data between tabs, and praying your VLOOKUP formulas don't break. Then, more time in Canva or PowerPoint trying to make the numbers look presentable.
You end up spending hours reporting on performance instead of doing the work that improves performance.
There's a better way.
What makes a creative reporting tool easy to use
Before evaluating options, know what separates genuinely user-friendly tools from platforms that just claim to be "intuitive":
Essential features for junior marketers:
Ability to play video ads within reports
Clear visualization of data and metrics
Pre-built templates for common report types
Easily shareable links for guests (agencies or clients)
Auto-syncs with your ad platforms (no manual CSV exports)
The best tools let you create a professional report in under 10 minutes. If it takes longer than that, you're using the wrong platform.
Motion: creative reporting built for marketers, not data scientists
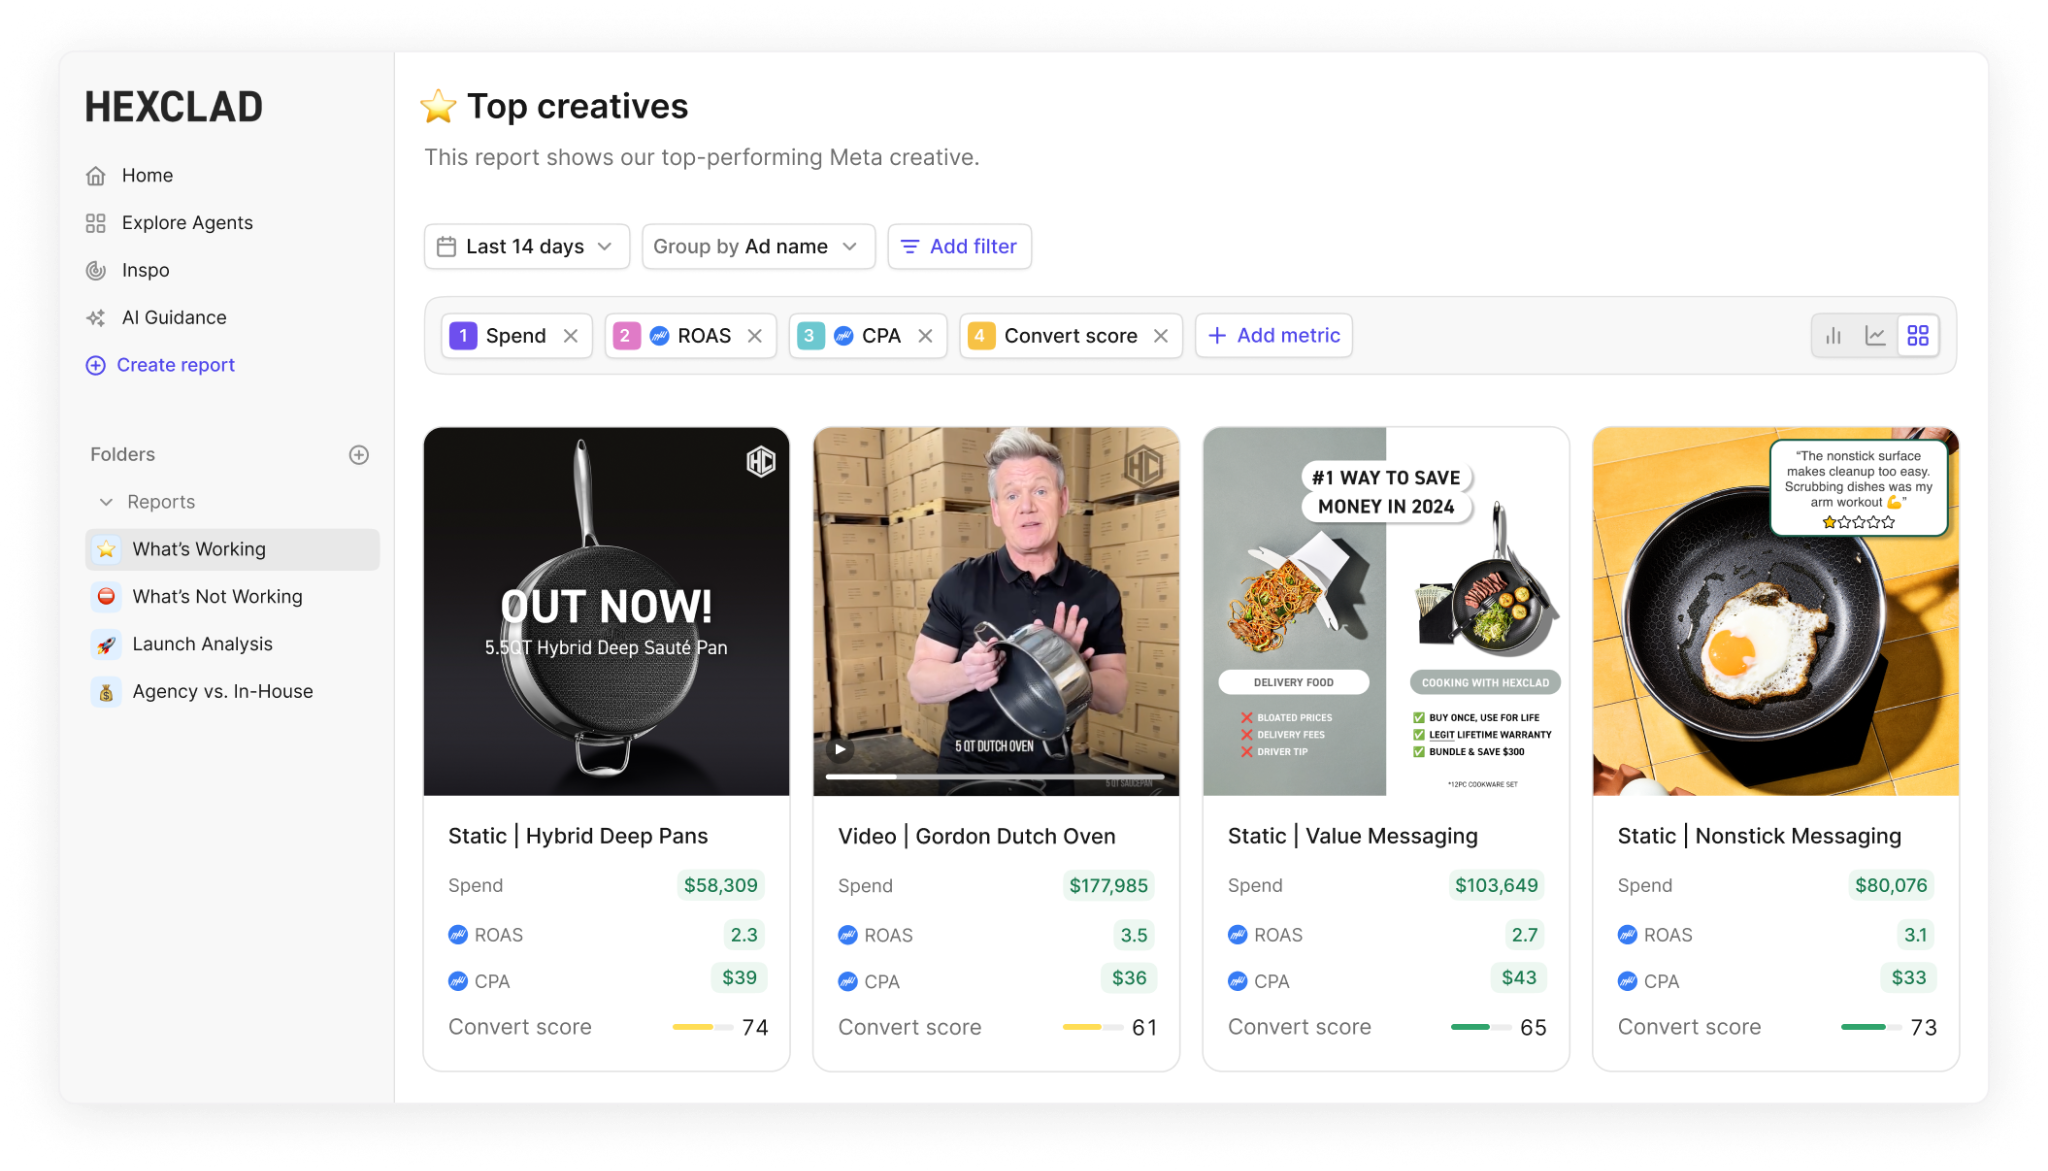
Motion connects directly to your Meta and TikTok ad accounts and automatically pulls creative performance data. It makes creating compelling reports a breeze:
Visual creative comparison tools let you see which ad variations are winning at a glance. No spreadsheet analysis required.
Pre-built report templates for common scenarios like weekly performance updates, creative testing results, and client-facing monthly reports. Start with a template, customize it by campaign, ad format, timeline, and much more.
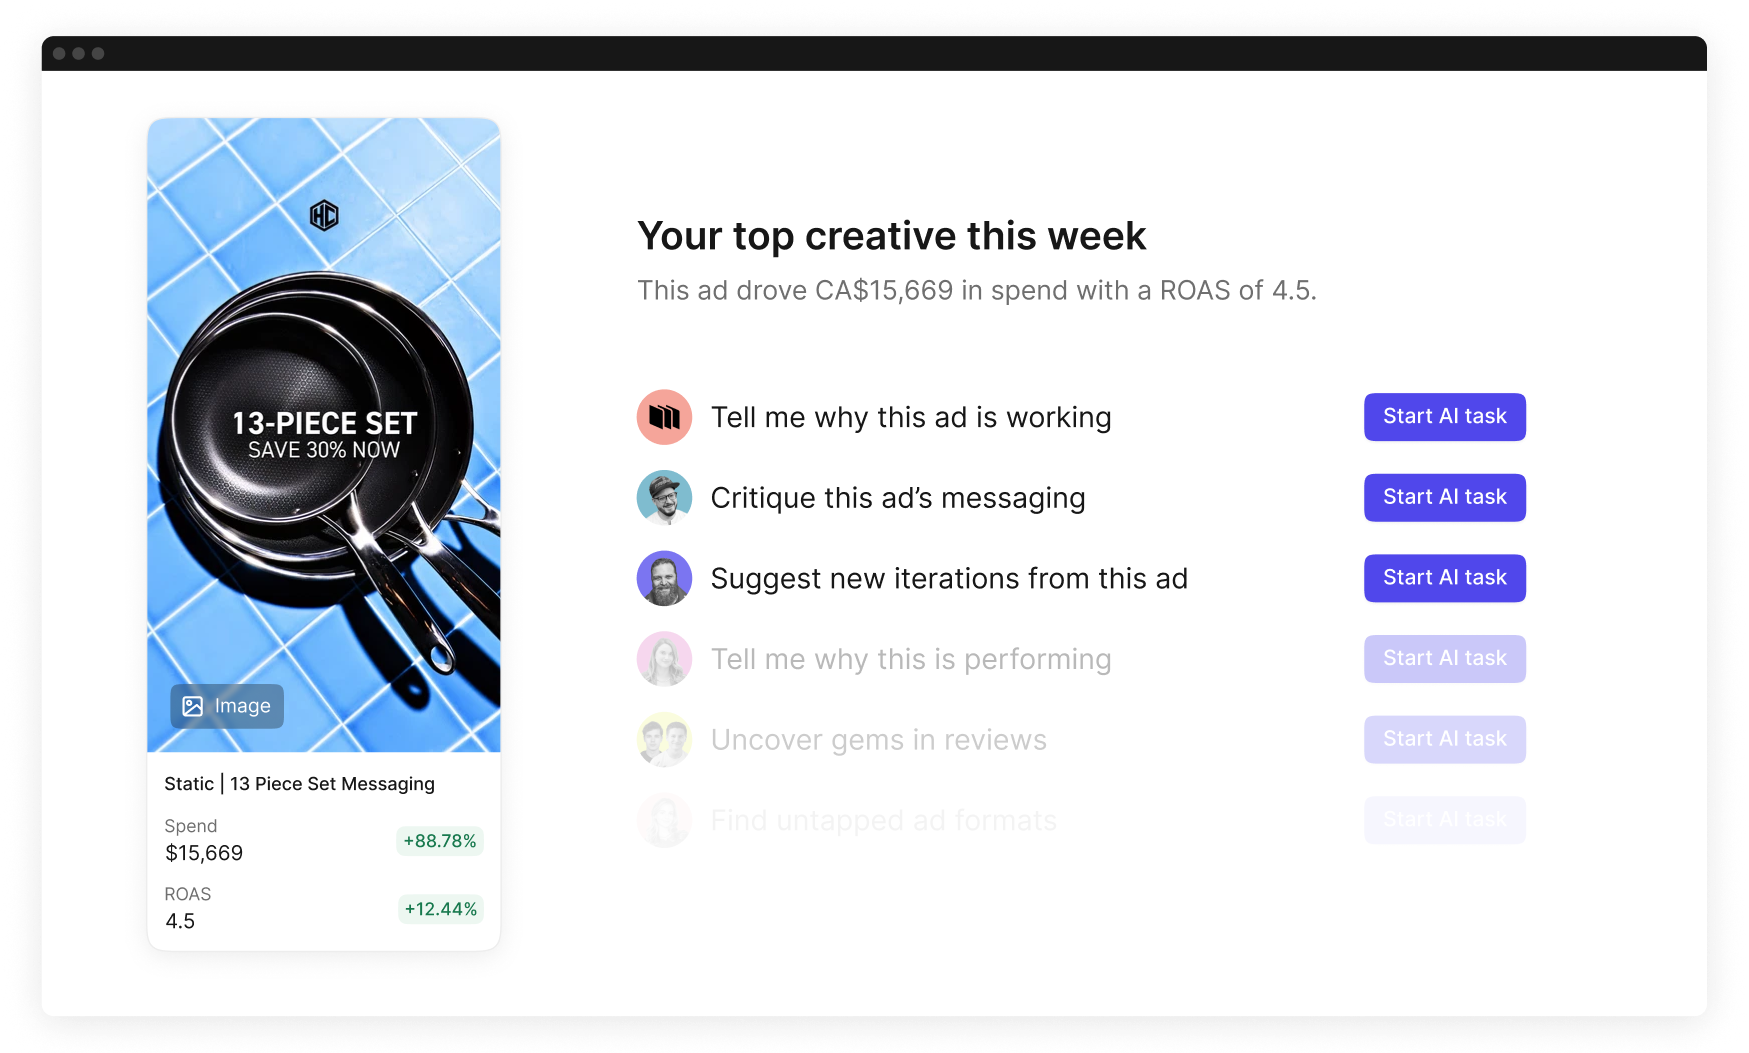
AI agents that help you find patterns hidden in your ad data so you can understand what’s working and why.
At ClickUp, Motion has enabled creative teams to take over reporting on their own tests. The media buyers save hours every week, and copywriters take ownership of their own performance data.
All the media buyers have to do is duplicate a report and add a new campaign ID. Whoever came up with a test can track weekly updates themselves.
How to choose the right creative reporting tool
Start by asking yourself these questions:
Which platforms do you advertise on? Make sure your reporting tool supports them. Motion covers Meta, TikTok, Youtube, and LinkedIn, but is most robust for Meta.
Who needs to see your reports? Internal stakeholders might be fine with dashboard access, but client-facing reports need polished, shareable outputs.
What's your technical skill level? Be honest. If you're not comfortable with SQL or data modeling, you need a tool designed for marketers, not analysts.
How much volume do you need? If you only launch a few ads per month, creative reporting tools might not be worth their cost. If you run 10+ ads per week or spend $25K+ per month, reporting becomes more important (and time-consuming).
If you're a junior marketer working with Meta or TikTok ads, spending a lot or launching a high volume of ads, and need to understand performance quickly, Motion can help you.
If you’re at a brand or agency with low ad spend or volume, you may not see value yet from creative reporting tools like Motion.
Getting started with creative reporting
Most platforms offer free trials. Take advantage of them, but be strategic about your evaluation.
In your first week:
Connect your ad account and let it pull historical data
Try creating the report(s) you make most frequently
Time yourself; see how much time you’d actually be saving
Share the result with a colleague and get feedback on clarity
Check if the tool's output actually looks professional enough to send to your manager or clients
The best tools will help you learn to use them through onboarding sessions, customer support, and help articles.
Frequently asked questions
What is the best creative reporting tool for beginners?
Motion makes data easy to understand for marketers without technical backgrounds. The visual interface and pre-built templates mean you can create professional reports in minutes without training or analytics expertise.
Do I need to know SQL or data analytics to use creative reporting tools?
Not with Motion. The platform is built for marketers, not data analysts. All you need to know is which metrics matter for your brand.
Can I create client-ready reports without design skills?
Yes. Motion's templates and visual report builder handle the design work for you. Select a template, customize your data, and share.
What's the difference between creative reporting and performance reporting?
Creative reporting focuses specifically on how your ad assets perform; which images, videos, headlines, and copy variations drive results. Performance reporting is broader and includes audience data, budget allocation, and overall campaign metrics.
How long does it take to build a creative report?
With Motion, most reports take 5-10 minutes from start to finish. Manual report-building using spreadsheets and presentation software typically takes 2-4 hours for the same output.
Key takeaway
Junior marketers don't need more complexity in their reporting tools. Motion turns Meta and TikTok creative performance data into visual, shareable reports in minutes, giving you more time to actually improve campaign performance instead of wrestling with spreadsheets.
Ready to stop spending hours on reports?Try Motion free and create your first creative report in under 10 minutes.
Get a tour of Motion’s creative analytics platform. We’ll even build free sample reports for you using live data from your TikTok, Meta, and YouTube ad accounts.
Subscribe to Thumbstop for the latest insights, templates, and techniques to ship more winning ads on Meta, TikTok, and Youtube.
By entering your info, you'll join 70k+ media buyers and creative minds reading Thumbstop for a weekly dive into everything creative strategy. (Unsub anytime in a click)
Love this article?
It originally appeared in Thumbstop—a free weekly newsletter filled with tips to help you ship winning Meta, TikTok, and YouTube ads.
By entering your info, you'll join 25k+ media buyers and creative minds reading Thumbstop for a weekly dive into everything creative strategy. (Unsub anytime in a click)


.png)


