What are the key metrics for evaluating creative performance?
Key metrics for evaluating creative performance include spend, thumbstop rate, hold rate, click-through rate (CTR), cost per action (CPA), and return on ad spend (ROAS). These metrics reveal whether your creative captures attention, maintains interest, drives action, and delivers profitable results.
Spend, thumbstop, hold, and CTR are creative metrics. They help you understand how engaging your ad creative is, while performance metrics like CPA and ROAS help you gauge the business impact.
According to Meta, creative quality has a strong impact on sales, citing Nielsen research that found creativity drives 56% of a campaign’s ROI.
Understanding creative performance metrics
The first sign an ad has potential is spend. When you first launch an ad in Meta, it has to go through a learning phase while the algorithm searches for the right people to show it to.
In this learning phase, all you can really look at is spend. Other metrics may be inflated or deflated due to the small sample size, but if your ad is eating spend it’s a good sign that the algorithm will be able to find customers with this ad.
Creative performance breaks down into three stages: attention metrics that show if your creative stops the scroll, engagement metrics that reveal if it holds interest, and conversion metrics that prove it drives business results.
Attention metrics
1-second view rate
3-second hook rate / thumb-stop ratio
Pattern interrupt effectiveness
Engagement metrics
Hold rate (15-second views)
Average watch time
Video completion rate
Click-through rate
Conversion metrics
Conversion rate
Cost per action (CPA)
Return on ad spend (ROAS)
All three stages are important. If an ad has good attention and engagement metrics but poor conversions, your audience likes the ad but the offer or call to attention may be too weak. In a situation like this, try running the same hook and body with different calls to action. You could also try posting it organically instead.
Track metrics at each stage and shore up weak areas to keep creative performance strong.
Metrics that show if your creative captures attention
Hook rate (3-second view rate)
Hook rate measures the percentage of impressions that turn into 3-second video views. The formula is straightforward: 3-second video views ÷ impressions × 100. Meta's Ads Manager tracks this as "video hook rate," treating 3-second views as the first meaningful engagement threshold—the point where viewers make conscious decisions about continuing to watch.
Benchmarks:
Target 30-40% hook rate as your baseline for strong performance. Meta rewards content that quickly engages by serving it more efficiently, which translates directly to lower CPMs and cheaper cost per action. One practitioner's rule is ruthless: if 3-second view rate drops below 25%, it's a creative problem, not a media buying problem.
The first three seconds determine everything. Facebook's video analytics treat this as the moment casual scrolling becomes intentional engagement. Your creative needs to deliver a pattern interrupt strong enough to stop thumbs mid-scroll and make viewers think "wait, what is this?"
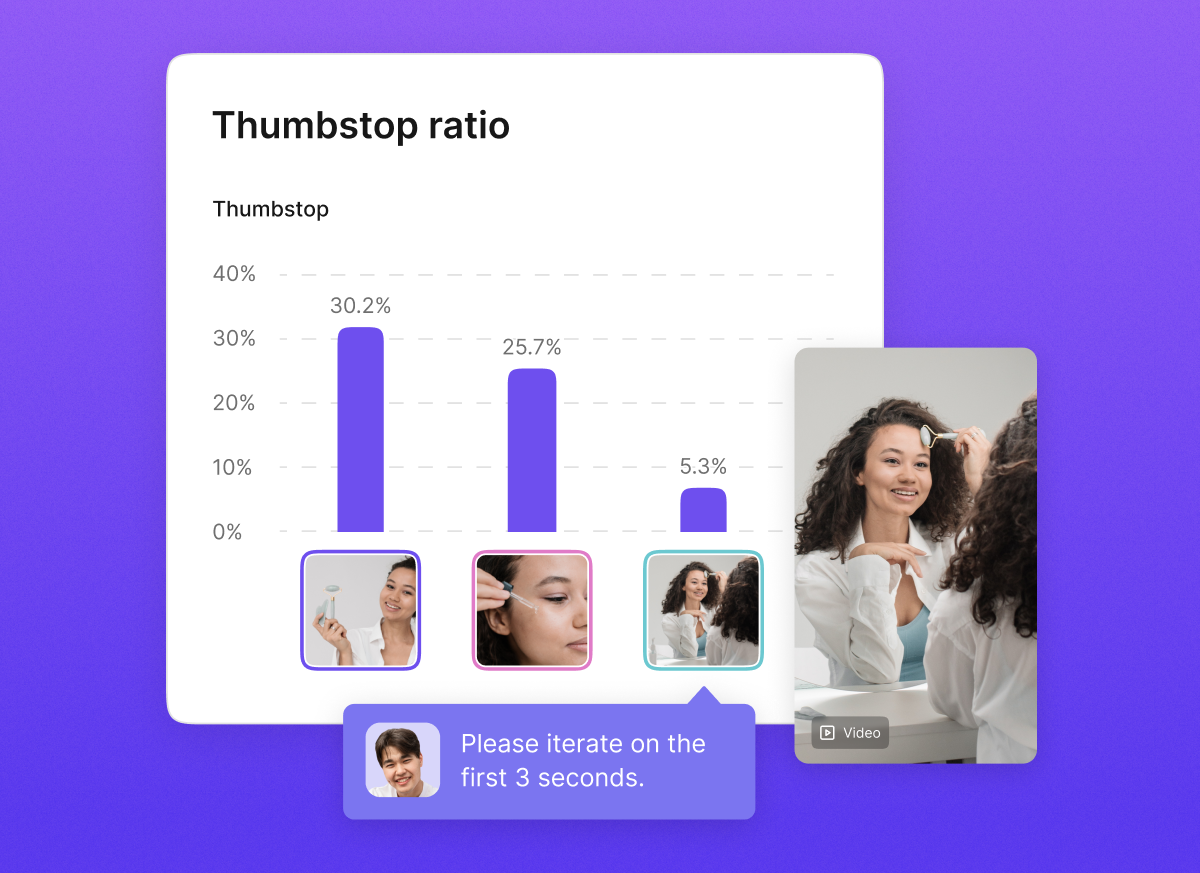
Thumbstop rate
Thumbstop rate (also known as hook rate or video hook rate) measures how well your hook is grabbing attention. It’s calculated as 3-second video plays ÷ impressions × 100. Thumbstop rates vary by industry, but here are some general benchmarks to shoot for;
Below 25%: needs work
25-35%: solid, but room for improvement
Above 35%: your creative captures interest quickly
Thumbstop rate is the first creative metric you need to get right to make winning ads. It doesn’t matter how strong the rest of your ad is if nobody watches it.
Strong hooks are foundational to creative strategy. Learn to think in hooks.
Measuring if your creative holds attention
Hold rate
Hold rate measures the percentage of viewers who stopped scrolling (3-second views) and continued watching to at least 15 seconds. The formula: 15-second video plays ÷ 3-second video plays × 100.
In other words: of the people whose attention you hooked, how many kept watching for 15+ seconds?
Average hold rates are 40-50%. Over 60% is considered strong, while under 30% hook rate suggests the ad needs work.
Strong hold rates rely on transitioning smoothly from your hook into the body of the ad. If your hook is something like “I save 10 hours a week on reporting!”, you need to follow that up with how.
The body of your ad has to logically follow the hook. Otherwise, viewers roll their eyes and keep scrolling.
Click-through rate (CTR)
CTR measures the percentage of users who saw your ad and clicked on it: clicks ÷ impressions × 100. CTR is a signal of intent; it shows whether your creative generates enough interest to prompt some kind of action, even if it doesn’t lead to a purchase.
Meta/Facebook benchmarks:
Average CTR across all industries: 0.9-1.5%
Strong performance: above 1.5%
Ecommerce specifically: aim for 1.5-2.5% (fashion averages 2.64%, electronics 1.91%)
TikTok benchmarks:
Average CTR: 0.84%
Typical range: 0.5-1.5%
Above 1.0% suggests creative is pulling its weight
Optimizing for CTR may not be as impactful as previously thought. Research from Martech suggests CTR influences only 4% of ROI. However, CTR is still useful as a diagnostic metric.
High CTR with poor conversion indicates misalignment; your creative promise is attracting clicks, but either the wrong audience is clicking or your landing page breaks the narrative the ad established.
The metrics that connect creative to business results
Cost per action (CPA)
CPA measures the cost to acquire a specific, pre-defined action; typically a purchase, lead, or signup. CPA casts a broader net than Customer Acquisition Cost (CAC), letting you pull more data points. This is especially useful if you know the average value of the action you’re tracking.
Return on ad spend (ROAS)
ROAS is revenue divided by ad spend. A ROAS of 3.2 means your ad generated $3.2 of revenue for every $1 it spent. It’s a good efficiency metric, but keep in mind that it doesn’t factor in costs of producing the ad or costs associated with making/shipping your product.
Average ROAS on Meta is 2.5-4.0, but you probably shouldn’t use that as a benchmark. Ideal ROAS for any brand is highly dependent on the lifetime value (LTV) of your customers.
Brands with high LTVs, such as subscription services or high repeat purchases, can be profitable with super low ROAS, sometimes even below 1.0. If your LTV is low, for example mattress brands or other infrequent purchases, you may need ROAS to be above 4.0 for ads to be profitable.
Conversion rate (CVR)
Conversion rate measures the percentage of clicks that turn into conversions. This metric connects mid-funnel engagement to revenue and is sensitive to both creative clarity and landing page experience.
Benchmarks:
TikTok average CVR: 1-3%
Meta/Facebook average CVR: 8-9%
Let’s say CTR is healthy but conversion rate is low. Before you blame the creative, examine landing page alignment. Does the landing page continue the narrative the ad started? Is there friction in the checkout process? Are you targeting the right audience?
If other ads are converting well with the same landing page, there’s either a problem with your ad or it doesn’t fit the landing page as well. An extreme example would be if you run an ad for one SKU but accidentally direct traffic to another product’s landing page. In this case your ad performance would tank because the ad doesn’t connect to the landing page.
Conversion rate reveals whether the interest your creative generates (CTR) translates into actual business outcomes, and it helps you identify whether creative message alignment or landing experience is the limiting factor.
How creative metrics differ by platform
Different platforms prioritize different engagement behaviors, which means winning creative needs platform-specific evaluation frameworks.
Meta/Facebook and Instagram
Meta's algorithm emphasizes video metrics: video hook rate, video hold rate, video average play time, and completion percentage. The platform's Ads Manager provides granular tracking for all three funnel stages—attention (1-second and 3-second view rates), engagement (hold rate, average watch time), and action (CTR, CPA, ROAS).
Strong Meta creative typically hits: 30-40% hook rate, 25%+ hold rate, 1.5%+ CTR for ecommerce, and CPA within target range. The algo rewards creatives that keep users engaged on-platform, so hold metrics significantly impact how efficiently your ads serve.
TikTok
TikTok measures success primarily through watch time and video completion percentage. The platform averages significantly lower conversion rates than Meta, but also typically offers lower costs per click and cost per mille.
Winning TikTok creative must feel native to the platform. Polished, production-heavy ads often underperform compared to user-generated content styles that match organic TikTok behavior. Completion rate is king; if viewers watch your full video, TikTok interprets that as high-quality content and serves it more aggressively.
Youtube
Youtube judges creative success heavily on view-through rate (VTR) and completion, especially for skippable formats. TrueView ads should target 15-30% VTR for shorter content, 2-10% for long-form. YouTube viewers have different intent than social media scrollers; they're often actively seeking content rather than passively consuming feeds, which changes what "successful engagement" looks like.
The point here is that the same metric can look different across platforms. The same ad might have a higher hook rate on TikTok than on Meta, but still convert higher in Meta. Evaluate metrics in relation to the specific platform the ad ran on.
How agencies balance creativity and performance metrics
Moving beyond vanity metrics
Vanity metrics look impressive on the surface but don’t actually mean much for business performance. Page views, social media followers, and impressions can fall into this category – they don't directly correlate with revenue or growth.
The shift from vanity metrics to performance metrics requires identifying where numbers stop short of showing business impact. A creative with 500,000 impressions and 15,000 likes might seem successful until you realize it generated 3 conversions at $847 CPA. The attention was there, the business results weren't.
Strong agency reporting ties creative KPIs to business outcomes; hook rate (did we stop scrolls?), hold rate (did we maintain interest?), CTR (did we generate intent?), CPA (what did conversions cost?), and ROAS (did we make money?). This framework connects creative decisions directly to pipeline, revenue, and ROI.
The danger of single-metric optimization
Optimizing for only one KPI creates blind spots. Single-metric optimization can lead to gaming that specific number while other performance indicators crater.
Example scenario: you optimize purely for CTR. Creative teams start using increasingly clickbait-style hooks that drive CTR to 4.5%. You triple CTR but conversion rates tank because you're attracting curious clickers who have no purchase intent. CPA explodes, ROAS collapses, but hey, CTR looks great in the deck.
Effective creative measurement requires evaluating multiple signals simultaneously. Use a multi-KPI mindset: creative decisions should weigh attention + engagement + conversion rather than chasing a single metric.
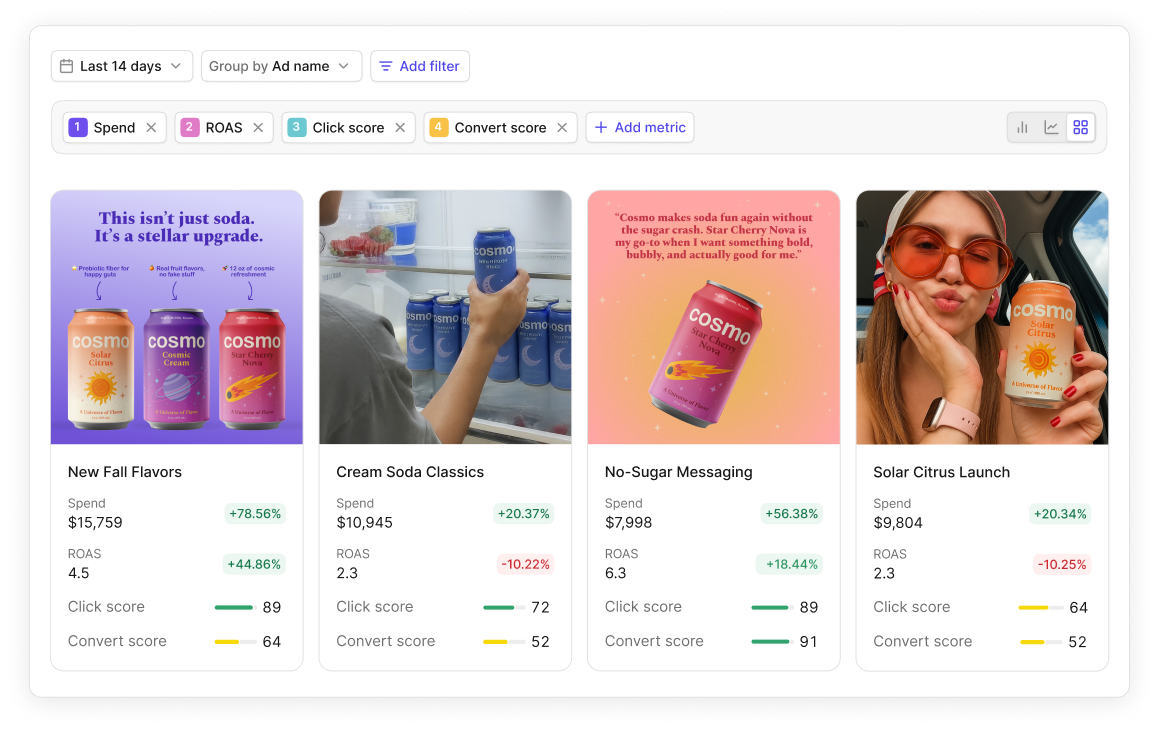
Creative performance dashboards
Motion solves the "wall of numbers" problem by aggregating creative metrics from Meta, TikTok, and YouTube into unified creative analytics views. This allows agencies to show clients which specific ads and creative angles drive ROAS, not just which campaigns generated clicks.
Creative analytics organizes the data related to marketing assets and ad creatives to identify patterns and understand audience preferences. A creative performance dashboard that updates daily allows teams to spot winning patterns and failing creatives before they waste significant budget.
For agency client reporting, focus on the metrics that matter most for the client's business model. Ecommerce clients care about ROAS and CPA. Lead generation clients care about cost per lead and lead quality. Brand awareness campaigns might prioritize reach and engagement.
Tailor your dashboard to surface the metrics that connect creative performance to client goals.
Measuring creative performance effectively
As mentioned in the intro, creative quality has a huge effect on ad performance. This means creative teams and performance marketers need to be fluent in creative metrics.
A practical measurement stack tracks three funnel stages:
Attention: 3-second hook rate (target 30-40%, flag below 25%)
Engagement: Hold rate (target 25%+), average watch time (aim for 50% of video duration), completion rate (30-40% is strong)
Action: CTR (Meta 1.5%+, TikTok 0.8-1.0%+), conversion rate (Meta ~9%), CPA and ROAS against your specific goals
The optimization logic is straightforward. Hook rate low? Fix the first three seconds with stronger pattern interrupts. Hook rate strong but hold rate weak? Improve your story arc and proof points. Converting well but not reaching enough people? Scale the media buy. Metrics tell you exactly where to focus creative iteration.
The brands winning in paid social measure smarter and iterate faster based on data that reveals exactly what's working and what's not.
FAQ
What's the most important creative performance metric?
Any metric taken out of context is a vanity metric. CPA and ROAS are the final judges of success, but they only make sense when attention and engagement metrics are healthy. If you don't know why performance is good or bad (whether it's a hook problem, hold problem, or conversion problem) you can't improve it systematically.
How long should I test creative before evaluating performance?
Let creative run for at least 3 days with minimum volume thresholds before making hard calls. Target at least 2,000 impressions, 50-100 clicks, or 3-5 purchases per creative before evaluating. Kill rules should trigger when a creative underdelivers for 48-72 hours with signals like CTR less than 50% of control or CPA more than 25% worse than target.
What's a good hook rate for Facebook ads?
Anything above 35% means your ad captures interest quickly. Performance between 25-35% is decent but leaves room for improvement. Below 25% signals it's time to rework your opening. Target 30-40% hook rate as your baseline for strong creative that Meta will serve efficiently.
Get a tour of Motion’s creative analytics platform. We’ll even build free sample reports for you using live data from your TikTok, Meta, and YouTube ad accounts.
Subscribe to Thumbstop for the latest insights, templates, and techniques to ship more winning ads on Meta, TikTok, and Youtube.
By entering your info, you'll join 70k+ media buyers and creative minds reading Thumbstop for a weekly dive into everything creative strategy. (Unsub anytime in a click)
Love this article?
It originally appeared in Thumbstop—a free weekly newsletter filled with tips to help you ship winning Meta, TikTok, and YouTube ads.
By entering your info, you'll join 25k+ media buyers and creative minds reading Thumbstop for a weekly dive into everything creative strategy. (Unsub anytime in a click)