

CREATIVEBENCHMARKS

See where you stand next to the best advertisers in the world.
Share with ChatGPT/ClaudeAdvertising is described as a science of prediction.
The right message, the right angle, for the right audience. Marketers often try to isolate and optimize as many variables as possible so that they can guarantee an ad’s success. But in practice, most ads are forgettable. And that’s okay. This report examines why that’s normal and what it suggests about how creative strategy should actually work.
We analyzed an anonymized dataset of +550,000 ads launched by +6,000 advertisers, representing roughly $1.3 billion in spend across Facebook and Instagram between September 2025 and early January 2026.
The window spans one of the most competitive promotion cycles of the year — pre-holiday testing, Black Friday and Cyber Monday (BFCM), and the post-holiday reset.


Several patterns stand out:
Winning ads are rare. Only a small share of ads — roughly five percent — spend at least 10× their account median. Low hit rates are not necessarily a sign of weak creative. They are a statistical feature of how performance advertising works.
Scale changes frequency, not fundamentals. Larger advertisers surface more winning ads because they introduce more variation into the system. Smaller advertisers are not excluded from getting winners, but they get them less often.
Trends are not universal. The most popular ad formats are not always the ones that capture the most spend. Performance shifts with context — scale, industry, timing, and saturation.
Want to see how your data stacks up to these benchmarks?
Create a free Motion account and our AI will tag your ads based on formats, hooks, and asset types so you can close gaps and spot opportunities.


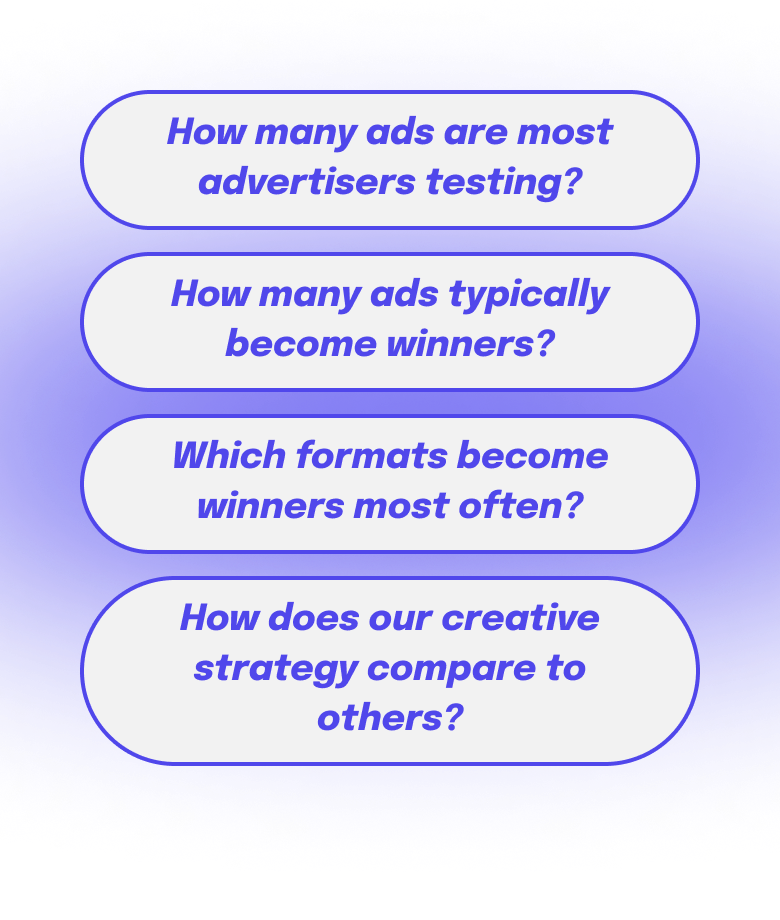
This report is designed to describe the system surrounding performance advertising. It focuses on the mechanics that shape successful ad accounts. These benchmarks are meant to help teams answer four fundamental questions with clear context.
The four biggest questions in creative strategy...


Part 1: The Search for Winners
Creative volume is a structural advantage
Across industries and budget sizes, one pattern is consistent. Advertisers that launch more ads get more winners.
This doesn’t mean they are better at predicting what will work. It means they are running more tests in an environment where wins are rare.
Ad performance on Meta behaves like probability. Roughly half of all ads don’t receive spend — or they receive very minimal amounts of spend. Meanwhile, 6% of ads are responsible for the majority of the spend in any given account. Put simply, a very small number of ads “work.” Each new ad that an advertiser launches is another chance to find one of these standouts.
-
-
What separates stronger advertisers is not sharper intuition. It’s how their testing cadence works. They create enough new ideas to give wins a chance to appear, and they notice when something starts to take off.
This pattern shows up even when comparing advertisers with similar budgets. Bigger budgets allow more testing, but the pace of launching new ads explains the difference between top-performing brands and everyone else.
In simple terms, volume helps because it creates more opportunities to get winners. It doesn’t make the average ad better. It increases how often an advertiser runs into something exceptional.
In a system where big wins are uncommon but crucial, taking more chances matters more than being certain about any individual ad.
Winners are rare — and that’s okay
If spend was more evenly spread out, improving results would mostly be about optimization. The data shows that’s not how it works. Most ads don’t spend, or they spend very little. Meanwhile, a small number of ads receive far more spend than the rest.
Many ads spend very little, a few ads spend a lot
Toggle between the different sizes of business below to see the proportion of ads at different levels of spend
This isn’t just a holiday effect. It’s not a sign of bad creative decisions. It’s how performance advertising behaves.
In this report, we use a strict definition of a winner. In order to become a winner, an ad must spend at least 10× more than the account’s median ad. This helps us find ads that truly stand out, not just ads that run a bit longer.
As accounts get larger, the bar gets higher. Bigger brands run more ads and spend more overall. That raises the level of spend an ad must reach to stand out compared to the account average. Winners grow unevenly as volume increases.
This helps explain a common frustration. When results are predictably inconsistent, it doesn’t always mean an ad that doesn’t spend is “weak.”
It suggests that advertisers are much better off asking themselves why an ad worked than why it didn’t. Because the majority of ads will predictably fail, understanding your winners has significantly greater impact on your account than interrogating “losing” ads.
Rethinking hit rate
Hit rate is often used as a scorecard for creative strategists. A high hit rate can look like proof that a marketer knows what will work. It can be treated as a measure of someone’s intuition or quality of judgement.
But on the contrary, high hit rates may actually signal that someone isn’t testing enough to maximize their accounts’ potential.
Two accounts can have the same hit rate but work very differently. One might launch only a few ads and put most of their spend behind them. Another might test many ads and find a few strong outliers along the way. Hit rates are likely to look lower for the latter, despite more testing.


This is why high hit rates need context. They could mean strong judgment. They can also mean limited testing. The metric itself cannot tell you which is true. Lower hit rates often appear in accounts that test more ideas. More testing naturally produces more average ads as well as more winners.
Hit rate is still a valuable metric. But it is not a proxy for success. It just describes how often rare events happen within an account.
Mid-range spenders and portfolio logic
Between winning ads and losing ads sits a third group that often gets less attention: mid-range spenders.
These ads are not outliers. They never become winners. But they keep running, receive steady spend, and in many accounts they quietly support day-to-day performance.
The chart below shows how ads are split between three groups: losing ads, mid-range ads, and winners. Across spend tiers, mid-range ads make up a considerable share of active ads.
Winning ads make up a small share of portfolios, even for higher-spend advertisers.
Percentage breakdown of losing ads, mid-range spenders and winners by monthly ad spend.
The chart below looks at how spend is distributed across these portfolios. Here, a clear pattern appears. While winners typically absorb the largest share of spend, mid-range ads still carry a meaningful proportion of spend — particularly in smaller accounts.
Ad spend shifts toward winners as accounts grow, rather than spreading evenly across creatives.
Percentage breakdown of losing ads, mid-range spenders and winners by monthly ad spend.
These mid-range spenders play a different role than winners. They don’t spike performance. But they help keep spend stable.
Larger accounts often behave like volatile portfolios. Some ads aim for big gains. Others provide consistency. Winners can drive growth, but they are unpredictable.
Smaller accounts, on the other hand, depend more on stability. They have less budget for big swings and rely more heavily on sure bets.
Mid-range spenders make high testing volume easier to manage. When teams launch many ads, some will fail quickly. Without stable ads in the mix, that churn can create volatility. Mid-range ads act as a ballast.
A common mistake is to treat mid-range ads as failed tests. In a healthy account, they connect testing and scaling. They help keep performance steady while new ideas compete for spend.


How many ads should you be testing?
There’s no universal testing volume that’s “best” for all advertisers. The right testing volume depends on budget, team size, and how quickly an advertiser can produce new ideas.
Creative output varies widely across accounts. Some advertisers launch only a few ads per week. Others launch many more. This reflects resources and workflow as much as strategy.
Below are the median testing volumes listed out by vertical and by spend tier.
Creative volume rises with scale. As advertisers move up spend tiers, they typically launch more ads per week, surface more winners, and show higher average hit rates.
This reflects organizational capacity as much as budget. Larger advertisers are not simply spending more, they are building systems that support faster testing.
Within each spend tier, the pattern still holds. Top advertisers ship materially more creative than average. And the gap is not marginal.
For a smaller advertiser, testing a handful of ads per week may be enough to get winners. For a mid-market or growth-stage brand, that level of output is unlikely to produce enough surface area to generate as many winners as they could.
At larger scales, conservative testing virtually guarantees that winners will be rare because shipping volume is not designed to find them.
The most useful question creative strategists should be asking is are we shipping enough ads to make winners possible?
Many teams anchor output to comfort — what production and approval workflows can easily support. Our research suggests that this constraint is often organizational.
Creative strategy should be seen more as capacity planning than optimization.
Want to uncover the "why" behind your winners?
Motion's AI will identify your winners, then tell you what makes them tick.
Part 2: The Anatomy of Winning Ads
What types of ads should you be testing?
If ad performance works like probability, then not all ads have the same odds of success. Some formats, hooks, and types of assets surface winners more often than others.
This is where an opportunity exists for creative strategists. There is no perfect formula for understanding what will get spend. The strength of a creative strategist is in understanding and interpreting the patterns behind what does.
These patterns are what some might call “trending hooks” or “trending formats” or just “trends.” Instead of making recommendations based on a limited set of accounts, we’re able to look at how these formats are truly trending in aggregate.
Two simple measures — when considered together — help describe these patterns: hit rate and spend use ratio.
Hit rate looks at how often ads become winners.
It answers: How frequently did this format become a winner?
Spend use ratio looks at where spend was concentrated.
It answers: When we use this format, how likely is it to get spend?
How to read it:
- >1.0 → Format punches above its weight
- ≈1.0 → Performs as expected
- <1.0 → Overused relative to results
These are not the same thing. A format may produce many winners but not spend much relative to how often it is used. Another might rarely produce winners but receive a lot of consistent mid-range spend.
Neither metric says an ad format is “good” or “bad.” But formats with high hit rates and high spend use ratios suggest collective confidence.
When looking at the tables below, keep in mind that this dataset represents a very specific window (BFCM, gifting season) and that results are time-bound.
Top visual styles


The visual styles that attract the most spend are not always the ones that become winners most efficiently. And the visual styles with the highest hit rates are not always the ones that absorb the most budget.
Some visual styles sit at the intersection. Offer-first banners and demos show up prominently in both tables. These are scale formats. They are widely used, easy to deploy, and trusted when performance matters.
Other visual styles show high hit rates but lower spend use. Unboxing, POV, behind the scenes, and founder ads fall into this category. These tend to be more volatile formats.
Then there are high-volume visual styles that receive meaningful spend but become winners less often. These function as testing or coverage formats. They help teams explore ideas, even if most never become true winners.
Some visual styles are built for scale. Some are built for testing. And others are sustainable drivers of steady spend. The healthiest advertisers usually rely on a mix of all three.
Why top visual styles differ by vertical
It’s tempting to look at lists of “top-performing” or “trending” visual styles and treat them as universal advice. But advertising rarely behaves that neatly. When hit rates and spend use are broken down by vertical, patterns shift. A visual style that looks strong overall may perform well in one category and barely appear in others.
In fashion, culturally fluent and playful visuals produce the most winners. In finance and professional services, credibility-forward formats and explanatory visuals dominate. And in home and lifestyle, demonstration and process matter more than anything else.
For creative strategists, this changes how benchmarks should be used. Cross-industry rankings are descriptive, but competitive context is better. Visual styles that surface winners or get spend in your specific vertical are often more meaningful than platform-wide recommendations.
Top hooks & headlines


Looking across both hit rate and spend use, certain themes appear repeatedly.
Hooks that signal immediacy, clarity, or a concrete reason to act tend to surface often. Language tied to price framing, offers, urgency, and product newness reduces the effort required to understand the value of the ad.
Other hooks rely less on direct offers and more on attention. Curiosity, confessional framing, bold claims, or unexpected statements can interrupt scrolling and create tension or surprise.
It is also telling what appears less often near the top of these rankings. Broad lifestyle statements and vague benefit claims are common in advertising, but they surface less frequently among winners in this dataset. Messages that delay clarity or require more interpretation may struggle when attention is limited.
Keep in mind that these patterns are time-bound. The dataset includes heavy promotional periods (BFCM & the holidays), when shoppers are primed for deals and product announcements.
Hooks and headlines that emphasize immediacy or value naturally align with what shoppers expect during this window. In a different season, it’s reasonable to expect that this looks very different — a point that warrants future analysis.
Top asset types
Asset choice is not only a creative decision. It is also an operational one. Some asset types are easier to adjust, remix, and relaunch. Others take more time and coordination to produce. That difference affects how quickly a team can test ideas and respond to performance signals.
The table below shows how different asset types appeared among winners and where spend concentrated.


Text-forward assets create winners more often than many teams expect. Text-only ads, product images with text overlays, and simple GIFs frequently rank well. Their strength is speed and clarity. They can communicate value quickly and allow small framing changes without reimagining entire campaigns.
Because they are fast to produce, these assets also make experimentation easier. A team can test multiple variations in a short period, which increases exposure to different outcomes. In a system where rare events matter, the ability to try more variations can influence results.
Higher-production assets play a different role. In some cases, they signal credibility or brand quality. But they are slower to change. When iteration slows, the number of ideas tested often slows as well. That does not make these assets ineffective, but it changes how they function during testing.


Structuring your strategy for success
One major takeaway from this research is that advertising — and creative strategy — can be humbling.
For all the planning, optimizing, and iteration, creative performance resists tight control. The system is shaped by human attention, platform dynamics, and competition that never sits still. Outcomes cluster. A few ads carry accounts. Many barely move the needle.
Performance advertising looks less like careful optimization and more like broad exploration. Not blind guessing, but structured searching in an environment where winning is rare.
The role of a creative strategist is not to predict the future perfectly. It’s to build conditions where winning ideas can surface, where signals are noticed, and where decisions are made with evidence rather than attachment.
There is also something reassuring in the benchmarks themselves. They show that uneven win rates are not a personal failing or a team-specific problem. They are a shared reality across thousands of advertisers. The pressure to “crack the code” often oversells how deterministic performance advertising really is.
The advertisers who win out will not be the ones who eliminate failure. They will be the ones who make it survivable and routine. They’ll keep shipping high volume. They’ll keep adjusting. And they’ll keep looking for a signal in the noise.
*Key Benchmarks Summary
*Full Methodology.
*Download LLM files
Want to see how your data stacks up to these benchmarks?
Create a free Motion account and our AI will tag your ads based on formats, hooks, asset types - and more - so you can see can close gaps and spot opportunities.